
Introduction
In the ever-evolving world of cloud computing, resources are abundant, and their management can be intricate. The continuous monitoring of these resources, especially virtual machines (VMs), is paramount. Azure Dashboards offer a compelling and adaptable solution for such a task. In this guide, we’ll dive deeper into the intricacies of setting up an Azure Dashboard for VM performance monitoring, ensuring that you capture vital metrics and interpret them effectively.
Step-by-Step: Setting up Azure Dashboards for VM Performance Monitoring
Step 1: Log into the Azure Portal
Visit the Azure Portal (https://portal.azure.com). Before you sign in, ensure you have the necessary permission to edit or create dashboards. This might require coordination with your organization’s Azure administrator.
Step 2: Navigate to Your VM
Azure’s UI is designed for clarity. From the left navigation pane, marked with familiar icons, select the “Virtual Machines” option. This will present a list of your VMs. Identify and select the VM you’re targeting.

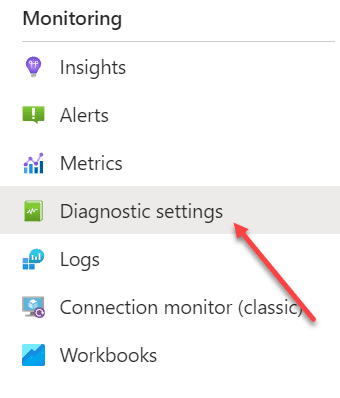
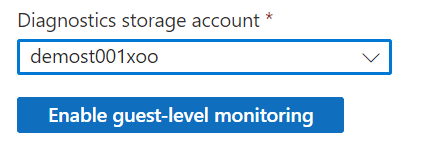
Step 3: Enable VM Performance Diagnostics
Under ‘Monitoring,’ you’ll find the ‘Diagnostic settings.’ This is the heartbeat of your VM. By enabling ‘Performance counters,’ you can gather rich data on your VM’s operations. Take your time here: choose the performance counters that resonate most with your VM’s role. The collection frequency, too, is vital. A high-frequency collection might offer more data, but consider the storage implications.
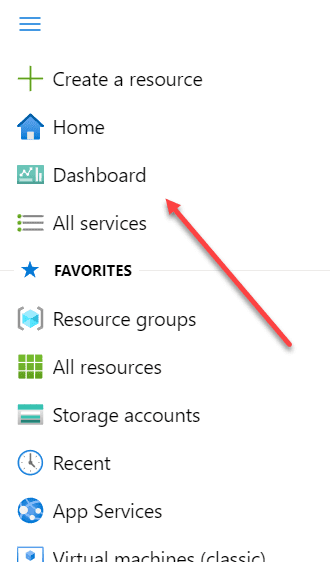
Step 4: Create a Dashboard
The Azure Portal’s main menu is your control center—the ‘Dashboards’ option beckons. On selecting, you’ll be prompted with existing dashboards, if any. Opt for ‘New Dashboard’ and give a name that screams its purpose.
Step 5: Add Performance Metrics to Your Dashboard
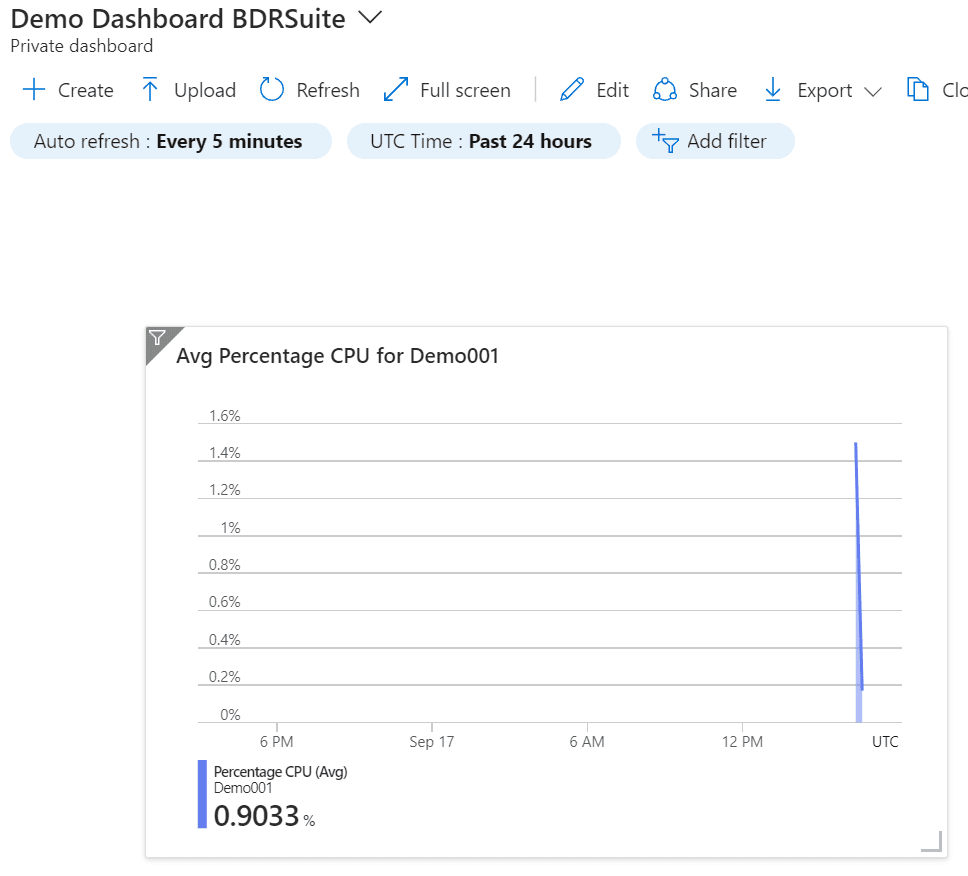
In ‘Edit’ mode, the tile gallery is your canvas. The ‘Metrics Chart’ tile is a masterpiece for data visualization. Dragging it to your dashboard, you’re prompted to configure it.
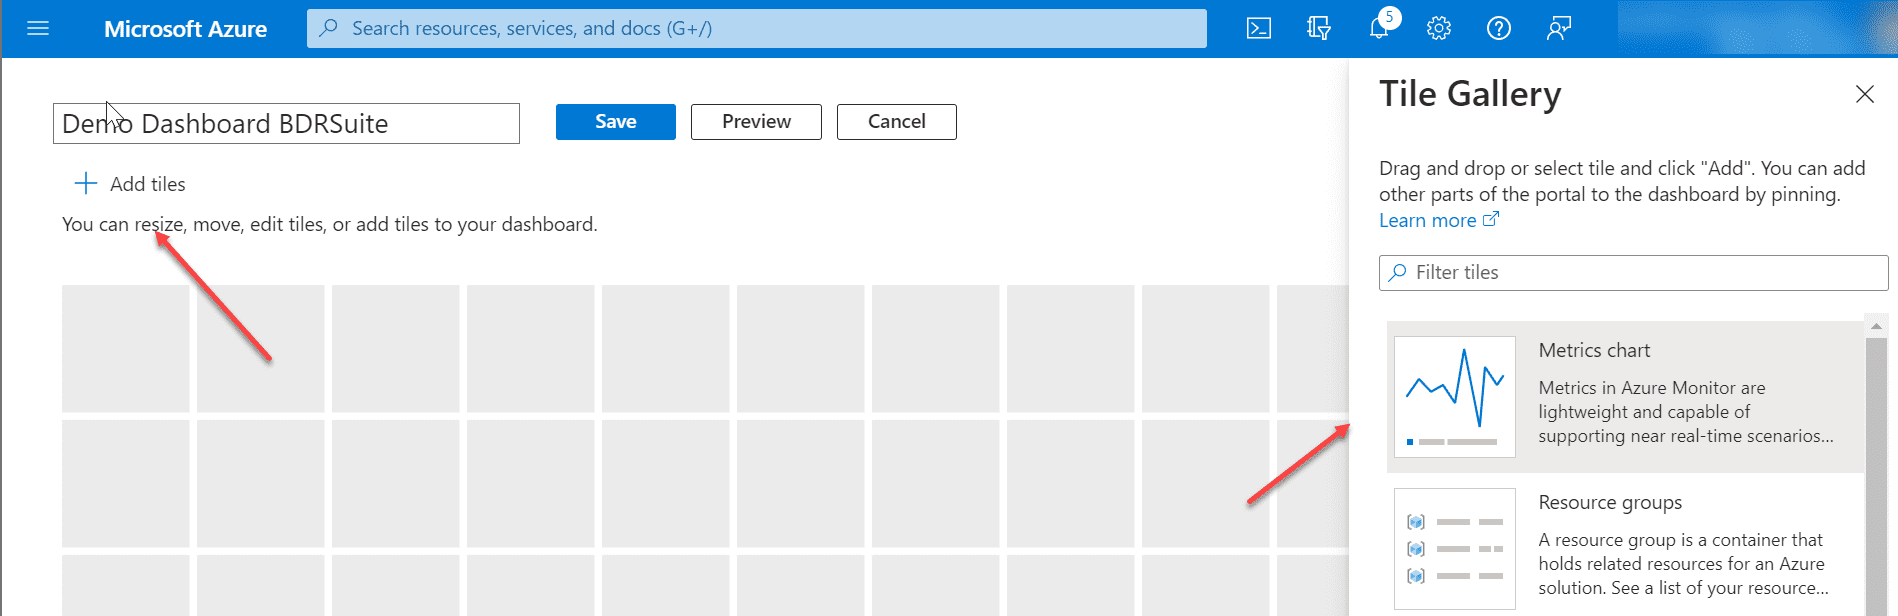
This is where Step 3 pays dividends. Select your VM as the source and paint your canvas with the metrics of your choice.

The result:
Best Practices for Setting Up Azure Dashboards for VM Performance Monitoring
- Select Relevant Performance Metrics: Not all metrics are born equal. Some shout; others whisper. For a data-intensive VM, disk I/O might be interesting, while CPU utilization could be intriguing for CPU-heavy tasks. Understand your VM’s primary role and select accordingly
- Set Up Alerts: Azure isn’t just about gathering data; it’s about insights. Set up alerts for thresholds that, if crossed, could spell trouble. Being proactive rather than reactive can be the difference between a hiccup and a crisis
- Optimize Collection Frequency: It balances data granularity and resource consumption. Does every second count, or is a snapshot every minute adequate? Decisions here influence storage costs and data manageability
- Customize Your Dashboard: Azure offers more than mere data representation; it provides clarity. Use color codes, label descriptors, and even different tile sizes to make your dashboard informative and intuitive
- Secure Your Dashboard: In the world of data, knowledge is power. Ensure that this power isn’t misused. Azure’s RBAC is a robust system that grants selective access. Use it wisely
Deep Dive into VM Monitoring: Beyond the Basics
Integration with Other Tools: Azure doesn’t exist in isolation. Tools like Power BI can elevate your data visualization. Explore integrations for a richer analysis experience.
Historical Analysis: Azure’s strength isn’t just real-time data. It stores historical data, offering trends and patterns. Periodic reviews can yield insights that can guide infrastructure scaling decisions.
Feedback and Collaboration: Dashboards are more than monitoring tools; they’re collaboration platforms. Please share them with your team, gather feedback, and continuously refine them for better clarity.
Conclusion
Within the extensive infrastructure of Azure, Dashboards can help you manage your infrastructure. They make it possible to show your Azure environment in understandable visual representations. This guide demonstrates that establishing these dashboards is relatively straightforward. The benefits are significant in terms of profound insights and proactive management. I encourage thorough exploration and experimentation, allowing Azure Dashboards to elevate your VM management practices to unparalleled standards.
Follow our Twitter and Facebook feeds for new releases, updates, insightful posts and more.

Leave A Comment